The resilience of the US economy continues to exceed our expectations. With encouraging progress toward ending the pandemic, and massive fiscal stimulus in place—and more likely coming soon, our prior economic growth forecasts may prove overly conservative. In addition, we believe a strong fourth quarter earnings season supports an increase in our earnings forecasts for 2021 and, in turn, our fair value S&P 500 target.
Economic Growth Poised to Accelerate in 2021
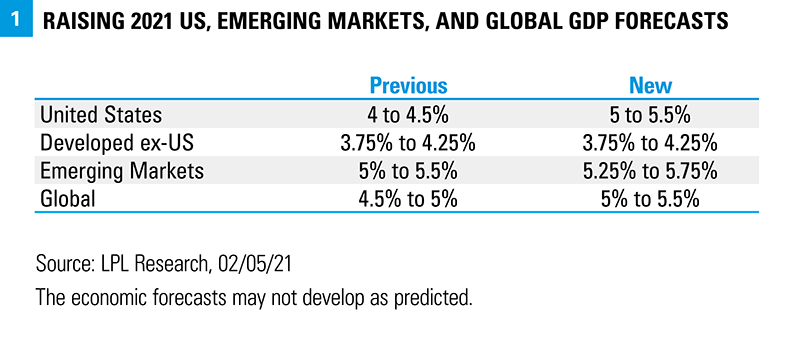
We are upgrading our 2021 forecasts for US gross domestic product (GDP) growth from 4–4.5% to 5–5.5% [FIGURE 1]. When we first issued our GDP forecast for 2021 in Outlook 2021: Powering Forward back in December of 2020, we did not expect additional fiscal stimulus to pass until this year (it came in the form of a roughly $900 billion package passed on December 29), nor did we anticipate another $1 trillion or more to come this spring, which is now very likely given the Democrats have control of Congress. Our ETA for another package at this point is late March, with the Democrats pursuing reconciliation requiring just 51 votes in the Senate (including Vice President Kamala Harris and 50 Democratic Senators).

Stimulus is the primary reason for the increase in our economic growth forecasts, though we are encouraged by the progress made toward ending the pandemic in recent weeks. The holiday surge in COVID-19 cases has largely passed, and new daily COVID-19 cases in the United States have fallen roughly 60% from the January 8 peak. Meanwhile, the total number of patients currently hospitalized with COVID-19 has fallen below 100,000 for the first time since early December. The vaccine rollout in the US has picked up speed—we are now averaging more than 1.3 million doses per day, according to the Centers for Disease Control and Prevention (CDC)—and additional vaccine candidates are likely coming soon that can help boost supply—in particular the Johnson & Johnson vaccine that is easier to transport and store. Prospects for better US growth should flow through to export-driven emerging market (EM) economies, so we have slightly increased our EM GDP growth outlook as well, in addition to our global GDP forecast.
Raising Our S&P 500 Index Fair Value Target on Stronger Earnings
The lockdowns and resulting deep recession from the pandemic led analysts to aggressively reduce earnings estimates last spring. Though not clear at the time, in hindsight those cuts have proved far too draconian. Earnings estimates for 2020 and 2021 bottomed in July and have been climbing steadily ever since, suggesting S&P 500 companies may recapture their 2019 pre-pandemic earnings power before the end of this year—a truly remarkable achievement considering the challenges.
A surprisingly strong fourth quarter earnings season increases our confidence in the outlook for corporate America. With about 60% of S&P 500 companies having reported, fourth quarter earnings for the index are on pace to grow about 2% year over year, according to FactSet—standing in stark contrast from the 13% decline reflected in analysts’ consensus estimate when the fourth quarter began on October 1, 2020. During just three full weeks of earnings reports, consensus S&P 500 earnings estimates for 2021 have increased by 3.6%, a period during which estimates typically fall 2-3%.
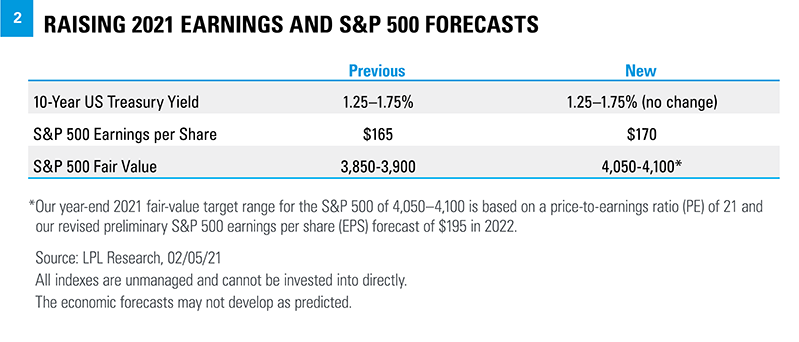
In light of the better US economic growth prospects and impressive performance by corporate America during the most recent quarter, we are raising our 2021 and 2022 S&P 500 earnings forecasts from $165 and $190 per share to $170 and $195 per share. Higher corporate tax rates in 2022 present some risk to that forecast.
A stronger earnings outlook supports higher stock prices, in our view, so we are also raising our year-end 2021 fair value target range for the S&P 500 from 3850–3,900 to 4,050–4,100 (4–6% above the February 5 close). The new target range is based on a price-to-earnings ratio of just below 21 times our 2022 earnings per share forecast of $195 [FIGURE 2].

Positioning Implications
As the economy fully opens and economic growth potentially accelerates more than we had previously anticipated, we believe the macroeconomic environment for value stocks may continue to improve. Growth stocks have had a tremendous run over the past decade—accentuated by the “stay-at-home / work-from-home” environment during the pandemic that gave many growth-style stocks an earnings boost. But over the past several months as vaccines have been approved (with more likely on the way), more stimulus arrived (also more potentially on the way) and investors gained more confidence in the reopening, value stocks have performed better. As a result, we are squaring up our views of growth and value. Strong growth-style fundamentals and our positive view of the technology sector keep us from a negative view of growth.
A stronger and fully open economy is also supportive of small cap stocks. We upgraded our view of small caps to neutral in September 2020 and continue to have a positive bias. The earnings recovery in smaller companies since last summer has been even more impressive than that of their larger counterparts.
From a sector perspective, stronger growth may bring more demand for energy globally. In addition, recent comments from OPEC + Russia suggest production increases may be quite gradual and could help provide support for oil prices which have already made a big move, gaining $20 in just the past 3 months to near $57 per barrel for WTI crude.
Conclusion
Our confidence in a full economic recovery is growing. A fully reopened economy is closer to becoming a reality on a combination of falling COVID-19 cases and hospitalizations, better treatments, more than a million shots going in people’s arms each day, and the resilience of the US consumer and businesses—both large and small—to power through the immense challenges the pandemic has presented. Plus massive fiscal stimulus likely to exceed 20% of US GDP and a Federal Reserve that is expected to remain supportive for the foreseeable future further solidify the bull case.
But the battle against COVID-19 isn’t over unfortunately. New, more infectious variants of COVID-19 are out there. The vaccine rollout will take time, and there will be holdouts. Consumer behavior may be slower to return to normal than we might expect. We see these risks as manageable at this point and believe the market will continue to look forward to life on the other side of the pandemic.
Click here to download a PDF of this report.
IMPORTANT DISCLOSURES
This material is for general information only and is not intended to provide specific advice or recommendations for any individual. There is no assurance that the views or strategies discussed are suitable for all investors or will yield positive outcomes. Investing involves risks including possible loss of principal. Any economic forecasts set forth may not develop as predicted and are subject to change.
References to markets, asset classes, and sectors are generally regarding the corresponding market index. Indexes are unmanaged statistical composites and cannot be invested into directly. Index performance is not indicative of the performance of any investment and do not reflect fees, expenses, or sales charges. All performance referenced is historical and is no guarantee of future results.
Any company names noted herein are for educational purposes only and not an indication of trading intent or a solicitation of their products or services. LPL Financial doesn’t provide research on individual equities.
All information is believed to be from reliable sources; however, LPL Financial makes no representation as to its completeness or accuracy.
US Treasuries may be considered “safe haven” investments but do carry some degree of risk including interest rate, credit, and market risk. Bonds are subject to market and interest rate risk if sold prior to maturity. Bond values will decline as interest rates rise and bonds are subject to availability and change in price.
The Standard & Poor’s 500 Index (S&P500) is a capitalization-weighted index of 500 stocks designed to measure performance of the broad domestic economy through changes in the aggregate market value of 500 stocks representing all major industries.
The PE ratio (price-to-earnings ratio) is a measure of the price paid for a share relative to the annual net income or profit earned by the firm per share. It is a financial ratio used for valuation: a higher PE ratio means that investors are paying more for each unit of net income, so the stock is more expensive compared to one with lower PE ratio.
Earnings per share (EPS) is the portion of a company’s profit allocated to each outstanding share of common stock. EPS serves as an indicator of a company’s profitability. Earnings per share is generally considered to be the single most important variable in determining a share’s price. It is also a major component used to calculate the price-to-earnings valuation ratio.
All index data from FactSet.
Please read the full Outlook 2021: Powering Forward publication for additional description and disclosure.
This research material has been prepared by LPL Financial LLC.
Securities and advisory services offered through LPL Financial (LPL), a registered investment advisor and broker-dealer (member FINRA/SIPC). Insurance products are offered through LPL or its licensed affiliates. To the extent you are receiving investment advice from a separately registered independent investment advisor that is not an LPL affiliate, please note LPL makes no representation with respect to such entity.
Not Insured by FDIC/NCUA or Any Other Government Agency | Not Bank/Credit Union Guaranteed | Not Bank/Credit Union Deposits or Obligations | May Lose Value
Tracking # 1-05108722 (Exp. 02/22)
